Conversion Tracking: How to Set It Up So You Can Actually Fix Things

@nadolconverts
Kacper Nadol

Every piece of conversion advice tells you to find where visitors drop off. Almost none of them explain how to actually see that, and most sites are not set up to show it. This article covers what conversion tracking needs to capture, how to structure it, and why most implementations produce data nobody can act on.
The Advice Nobody Can Follow
Almost every piece of conversion advice, including most of what is on this blog, tells you the same thing: find where visitors are dropping off, then fix that specific point. Diagnose before you intervene. Look at the data.
The problem is that most sites cannot do this, because the tracking is either not set up, set up badly, or set up in a way that records events nobody can actually use. The advice is sound and unusable, which makes it worse than no advice, because the team reads it, opens their analytics, finds nothing actionable, and concludes that diagnosis is not practical for them.
This is a widespread and largely invisible problem. Sites have analytics installed. Something is recording. There are dashboards with numbers on them. But when someone asks the specific question that matters, where exactly are qualified visitors leaving and why, the data cannot answer it. The tracking captures pageviews and sessions and a conversion event or two, and none of it maps to the decisions the team actually needs to make.
Fixing that is not glamorous work, and it is why most conversion programs stall before they start. You cannot improve what you cannot see, and most sites cannot see the thing that matters.
What Tracking Is Actually For
Before setting anything up, it helps to be clear about what conversion tracking is supposed to produce, because that determines what to measure.
Tracking exists to answer three questions. Where are people leaving? Why might they be leaving there? And did the change you made actually improve anything?
That is the whole job. Not to produce a comprehensive record of every interaction on the site. Not to build dashboards that look thorough. To answer those three questions well enough that you can make decisions and know whether they worked.
Most tracking implementations fail because they are built without this frame. Someone installs analytics, accepts the defaults, adds a conversion event when a form submits, and considers it done. The result records that conversions happened and nothing about the path that led to them or the paths that did not. It tells you the outcome without telling you anything about the cause, which means it cannot inform a single decision about what to change.
Tracking built around the three questions looks different. It captures the stages a visitor moves through, so you can see where the funnel narrows. It captures enough about who those visitors were, so you can tell whether a drop-off is a page problem or a traffic problem. And it is stable enough over time that you can compare before and after when you change something. The framework for what to do with that data once you have it is here: Website Not Converting? Here's How to Find Out What's Actually Wrong
Define the Conversion Before You Measure It
The first decision is what actually counts as a conversion, and getting this wrong makes everything downstream useless.
Most sites have more than one meaningful conversion event. A form submission. A demo booking. A trial signup. A purchase. A newsletter subscription. These are not equivalent, and treating them as one undifferentiated "conversion" number destroys the ability to see what is happening.
The clearer approach is to define a primary conversion, the thing that actually matters commercially, and track secondary conversions separately. If the business runs on booked calls, the booked call is the primary conversion and everything else is a supporting signal. Lumping a newsletter signup and a booked demo into the same metric produces a number that goes up when the wrong thing happens and tells you nothing about the health of the business.
It also matters where the conversion is counted. A form submission is not the same as a qualified lead, and a booked call is not the same as a call that happened. If the tracking stops at the form submit, you will optimize toward form submissions, which is exactly how sites end up converting well and producing nothing. The conversion event should sit as close as possible to the thing that actually creates value, and where it cannot, you need a way to connect the tracked event to what happened afterward. The distinction between converting and converting the right people is covered here: How to Qualify Leads on Your Website Without Killing Conversions
Track the Stages, Not Just the Outcome
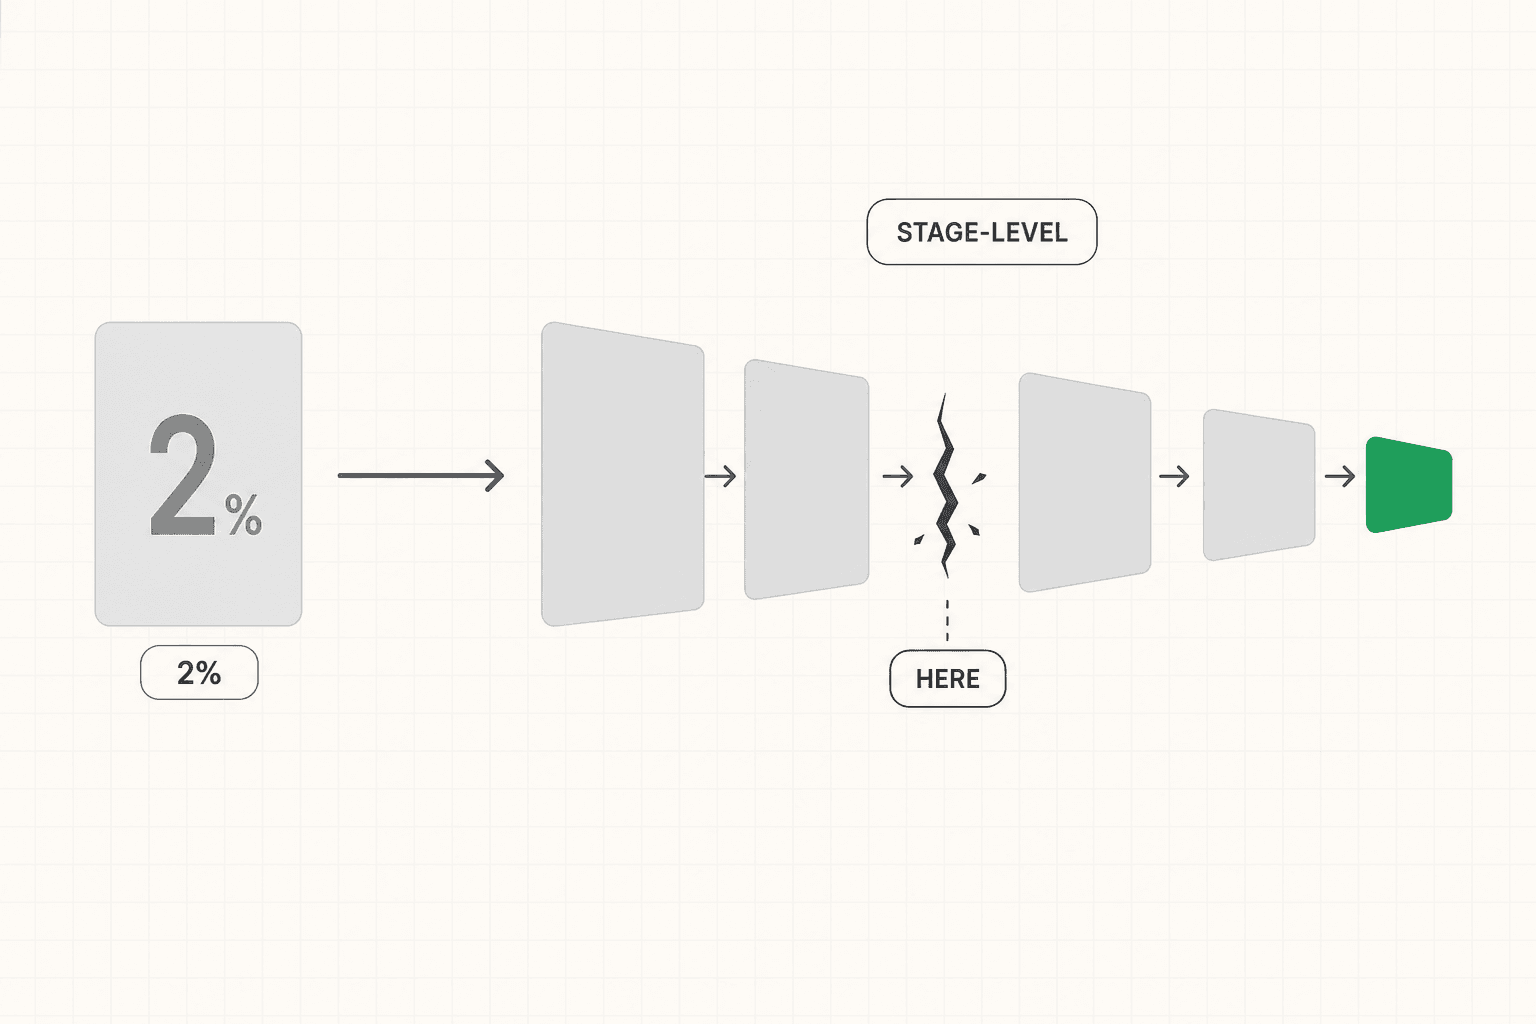
The single most useful thing most sites are missing is stage-level visibility. Knowing that 2% of visitors converted tells you almost nothing. Knowing where the other 98% stopped tells you what to fix.
This means defining the steps a visitor moves through on the way to converting, and measuring each one. On a landing page, that might be: landed, scrolled past the hero, reached the proof section, reached the CTA, clicked the CTA, started the form, submitted the form. On an ecommerce site: viewed product, added to cart, began checkout, entered payment, completed purchase.
Once each stage is measured, the drop-off between stages becomes visible, and the drop-off pattern points directly at the problem. Heavy loss between landing and scrolling past the hero means the top of the page is failing. Heavy loss between reaching the CTA and clicking it means the ask or the surrounding copy is failing. Heavy loss between starting the form and submitting it means the form itself is the problem.
Each of these has a different fix, and without stage-level tracking they all look identical from the outside: a low conversion rate. This is the difference between data that tells you something is wrong and data that tells you what is wrong.
Segment by Source, or You Will Misdiagnose
A conversion rate viewed in aggregate hides more than it reveals, and segmenting by traffic source is often the fastest way to find out whether you have a page problem or a traffic problem.
The scenario plays out constantly. A page converts at 2%. The team concludes the page is broken and starts rewriting it. What the aggregate number hides is that organic search traffic converts at 7% and paid traffic converts at 0.6%. The page is fine. The paid targeting or the ad-to-page message match is the problem, and every hour spent rewriting the page is an hour spent solving the wrong thing.
This works in the other direction too. A page that converts acceptably in aggregate might be performing terribly for the specific segment that matters most commercially, hidden by strong performance from a low-value segment.
Segmentation by source, and by device, are the two cuts that most often change the diagnosis. Device in particular tends to reveal problems nobody was looking for, because most teams build and test on desktop while a large share of their traffic arrives on mobile. A site that converts at 5% on desktop and 1% on mobile has a mobile problem, not a general conversion problem, and the aggregate number will never tell you that.
The habit worth building is to never draw a conclusion from an aggregate conversion number without first cutting it by source and device. It takes a minute and it changes the answer more often than most people expect. That instinct, checking whether the number you are looking at is hiding two different stories, is the kind of thing I write about most in the newsletter.
Where Most Implementations Go Wrong
A few failure patterns show up repeatedly and are worth knowing in advance.
Tracking that was set up once and never verified. Events fire, or they used to. Something changed on the site, a form was replaced, a button was rebuilt, and the event stopped firing. Nobody noticed because the dashboard still shows numbers, just lower ones, and everyone assumed performance dropped. Tracking needs periodic verification, especially after any site change.
Too many events, none of them meaningful. Some implementations record everything: every click, every scroll, every hover. The result is a dataset so noisy that nobody can find the signal, and the tracking gets ignored. More events is not better tracking. The right events, clearly defined, are better tracking.
Events that do not map to decisions. A common version is tracking clicks on a button without tracking what happened next. Knowing 400 people clicked "get started" is useless if you cannot see how many of them completed the thing they started. Every tracked event should connect to a decision someone might make about the site.
Conversion counted too early. Counting a form submit as the conversion when the actual value comes from a qualified booked call means the numbers look healthy while the pipeline stays empty. The tracked event drifts away from the business outcome, and the optimization follows the tracked event.
No consistent baseline. Changes get made, numbers move, and nobody can tell whether the change caused it or whether it was seasonality, a traffic mix shift, or noise. Without a stable baseline and a reasonable measurement window, you cannot attribute improvement to anything.

Quantitative Tells You Where, Qualitative Tells You Why
Conversion tracking gives you the where. It rarely gives you the why, and treating it as if it does leads to confident wrong conclusions.
Analytics can tell you that 68% of visitors leave without scrolling past the hero. It cannot tell you whether that is because the headline is vague, the page loads slowly, the ad promised something different, or the visual is pushing the message below the fold. The number identifies the location of the problem. Something else has to identify the cause.
That something else is usually qualitative. Session recordings show you what people actually did, including the hesitations and confusions that no event captures. Heatmaps show you where attention went and what got ignored. On-site surveys, asking visitors what they were looking for or what stopped them, produce answers no quantitative tool can generate. And sales call notes, for B2B, are one of the richest sources of why-information available, because they contain the actual objections in the buyer's own words.
The strongest diagnostic work pairs the two. Tracking narrows the search to a specific point in the funnel. Qualitative evidence explains what is happening at that point. Neither one alone is sufficient: quantitative without qualitative produces changes based on guesses about cause, and qualitative without quantitative produces changes based on anecdote with no sense of scale.
Start Smaller Than You Think
The most common reason conversion tracking never gets implemented properly is that the plan is too ambitious. Someone maps out a comprehensive measurement framework, it requires significant work across multiple tools, it goes on the roadmap, and it stays there.
A minimal implementation that works beats a comprehensive one that does not exist. For most sites, that minimum looks like this: one clearly defined primary conversion event that sits close to actual business value, the three to five stages a visitor passes through on the way to it, the ability to segment by traffic source and device, and a verification habit so you notice when something breaks.
That is enough to answer where people are leaving, whether the problem is the page or the traffic, and whether a change you made helped. Which is enough to run a real conversion program.
Everything beyond that is refinement, and refinement is worth doing once the basics are producing decisions. Building the elaborate version first usually means never getting to the part where the data actually changes what you do.
If your tracking is unclear or you are not sure whether the numbers you are looking at are trustworthy, that is worth resolving before any optimization work, because every change you make afterward will be measured against it. See how the 48h Audit works
The Short Version
Most conversion advice is unusable because most sites cannot see where they are losing people. Tracking exists to answer three questions: where are people leaving, why might they be leaving there, and did the change work.
Define a primary conversion that sits close to real business value rather than counting every event as equivalent. Track the stages, not just the outcome, because the drop-off pattern is what points at the problem. Segment by source and device before drawing any conclusion, because aggregate numbers routinely hide two different stories. Verify that events still fire after site changes, because silently broken tracking is worse than none.
And remember that tracking tells you where, not why. Pair it with session recordings, surveys, and sales call notes to find the cause once you know the location.
Start smaller than feels adequate. A minimal implementation that produces decisions beats a comprehensive one that never gets built.
Keep reading